

Automotive manufacturer General Motors (NYSE:GM) beat Wall Street’s revenue expectations in Q3 CY2025, but sales were flat year on year at $48.59 billion. Its non-GAAP profit of $2.80 per share was 20.5% above analysts’ consensus estimates.
Is now the time to buy General Motors? Find out by accessing our full research report, it’s free for active Edge members.
General Motors (GM) Q3 CY2025 Highlights:
- Revenue: $48.59 billion vs analyst estimates of $45.02 billion (flat year on year, 7.9% beat)
- Adjusted EPS: $2.80 vs analyst estimates of $2.32 (20.5% beat)
- Management raised its full-year Adjusted EPS guidance to $10.13 at the midpoint, a 11% increase
- Operating Margin: 2.2%, down from 7.5% in the same quarter last year
- Free Cash Flow Margin: 8.1%, down from 9.5% in the same quarter last year
- Market Capitalization: $55.22 billion
Company Overview
Founded in 1908 by William C. Durant, General Motors (NYSE:GM) offers a range of vehicles and automobiles through brands such as Chevrolet, Buick, GMC, and Cadillac.
Revenue Growth
A company’s long-term performance is an indicator of its overall quality. Even a bad business can shine for one or two quarters, but a top-tier one grows for years. Luckily, General Motors’s sales grew at a solid 10.1% compounded annual growth rate over the last five years. Its growth beat the average industrials company and shows its offerings resonate with customers.
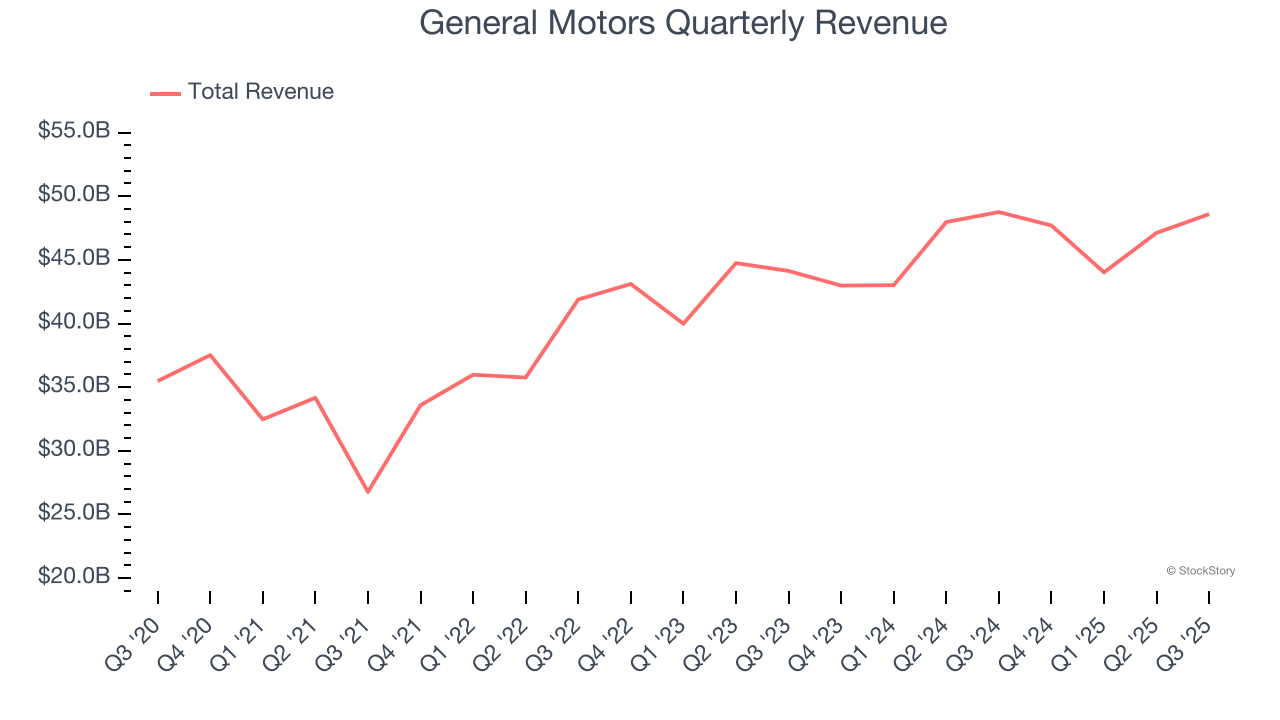
Long-term growth is the most important, but within industrials, a half-decade historical view may miss new industry trends or demand cycles. General Motors’s recent performance shows its demand has slowed as its annualized revenue growth of 4.4% over the last two years was below its five-year trend. 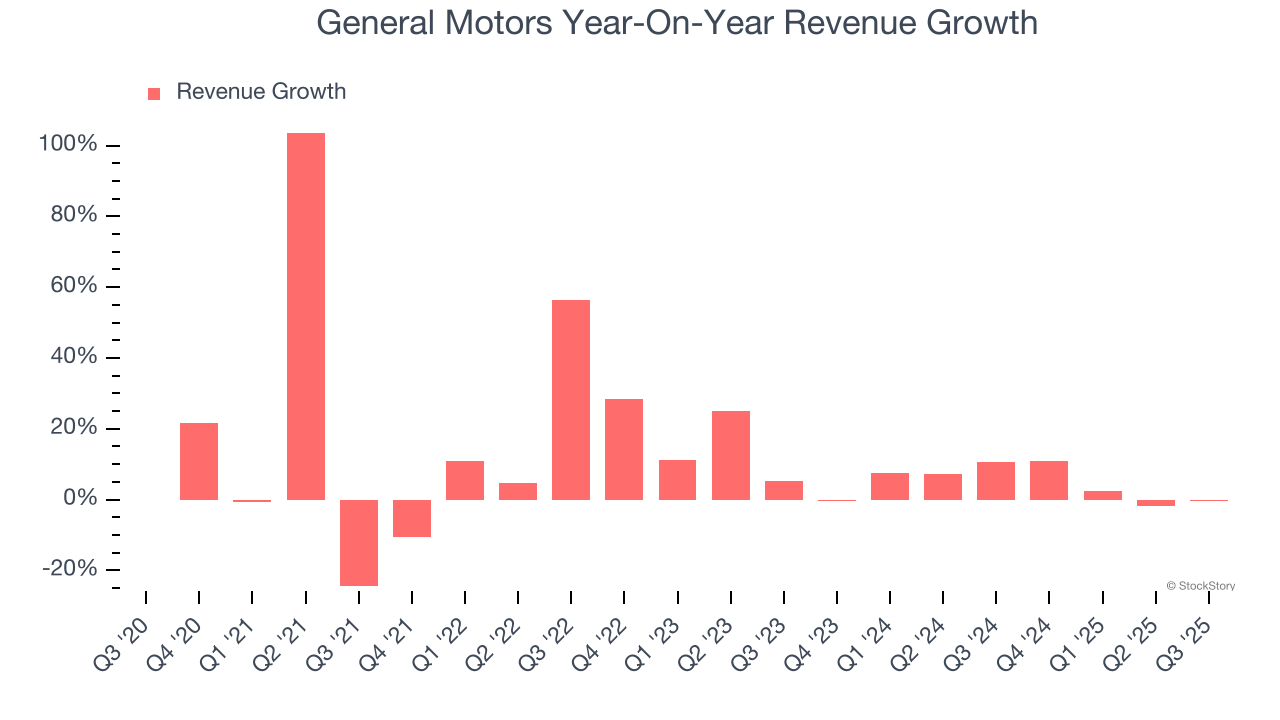
This quarter, General Motors’s $48.59 billion of revenue was flat year on year but beat Wall Street’s estimates by 7.9%.
Looking ahead, sell-side analysts expect revenue to decline by 4% over the next 12 months, a deceleration versus the last two years. This projection is underwhelming and suggests its products and services will see some demand headwinds.
Unless you’ve been living under a rock, it should be obvious by now that generative AI is going to have a huge impact on how large corporations do business. While Nvidia and AMD are trading close to all-time highs, we prefer a lesser-known (but still profitable) stock benefiting from the rise of AI. Click here to access our free report one of our favorites growth stories.
Operating Margin
Operating margin is one of the best measures of profitability because it tells us how much money a company takes home after procuring and manufacturing its products, marketing and selling those products, and most importantly, keeping them relevant through research and development.
General Motors was profitable over the last five years but held back by its large cost base. Its average operating margin of 6.2% was weak for an industrials business. This result isn’t too surprising given its low gross margin as a starting point.
Looking at the trend in its profitability, General Motors’s operating margin decreased by 3.8 percentage points over the last five years. This raises questions about the company’s expense base because its revenue growth should have given it leverage on its fixed costs, resulting in better economies of scale and profitability. General Motors’s performance was poor no matter how you look at it - it shows that costs were rising and it couldn’t pass them onto its customers.
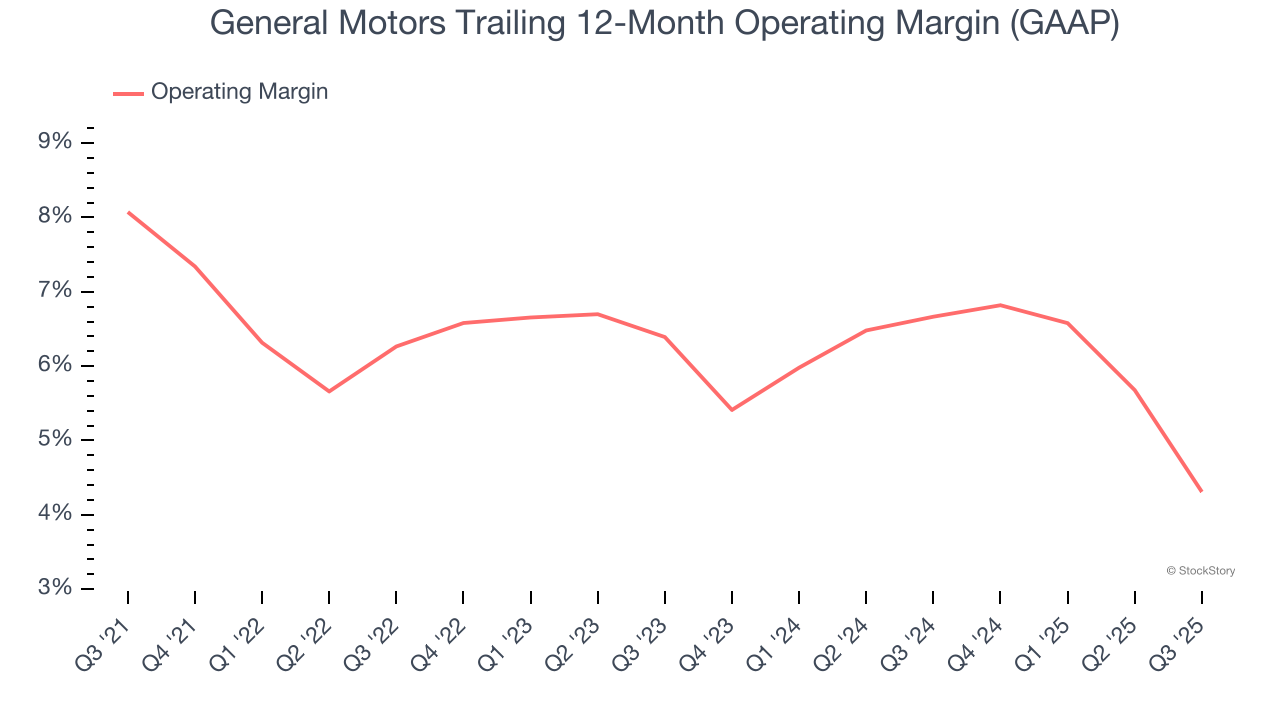
In Q3, General Motors generated an operating margin profit margin of 2.2%, down 5.3 percentage points year on year. Since General Motors’s operating margin decreased more than its gross margin, we can assume it was less efficient because expenses such as marketing, R&D, and administrative overhead increased.
Earnings Per Share
We track the long-term change in earnings per share (EPS) for the same reason as long-term revenue growth. Compared to revenue, however, EPS highlights whether a company’s growth is profitable.
General Motors’s EPS grew at an astounding 27.3% compounded annual growth rate over the last five years, higher than its 10.1% annualized revenue growth. However, this alone doesn’t tell us much about its business quality because its operating margin didn’t improve.
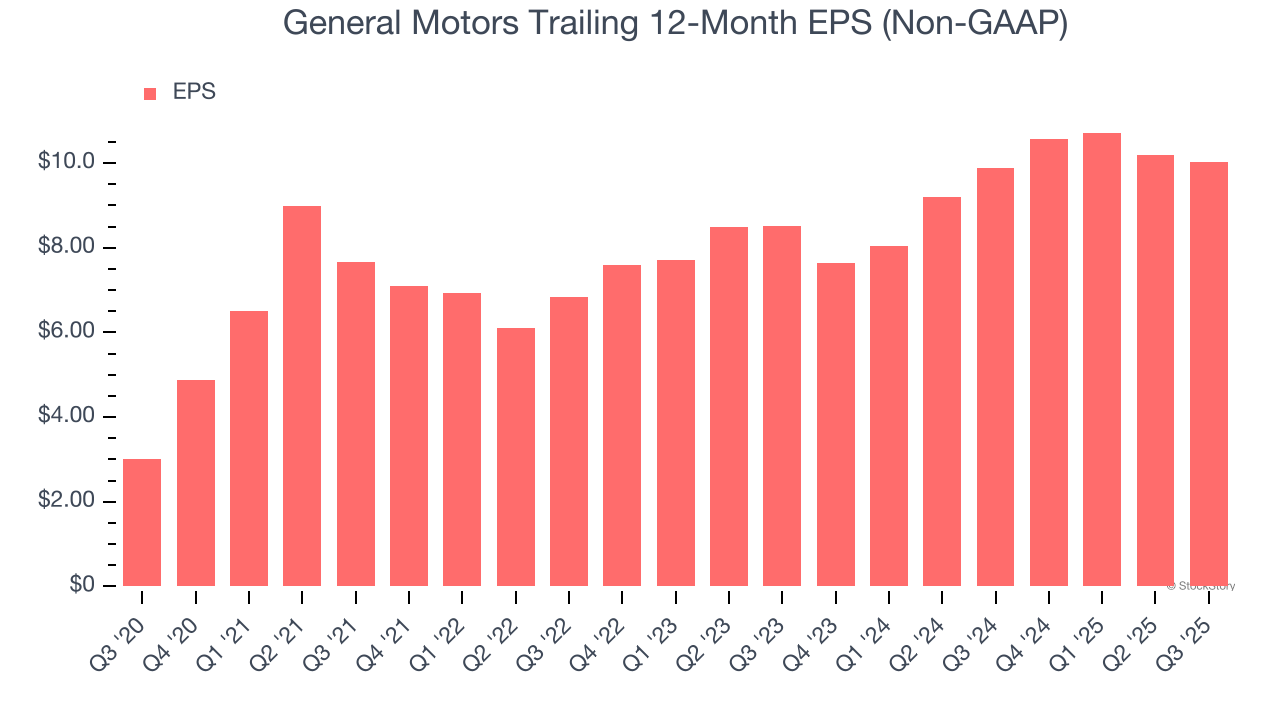
We can take a deeper look into General Motors’s earnings to better understand the drivers of its performance. A five-year view shows that General Motors has repurchased its stock, shrinking its share count by 33%. This tells us its EPS outperformed its revenue not because of increased operational efficiency but financial engineering, as buybacks boost per share earnings. 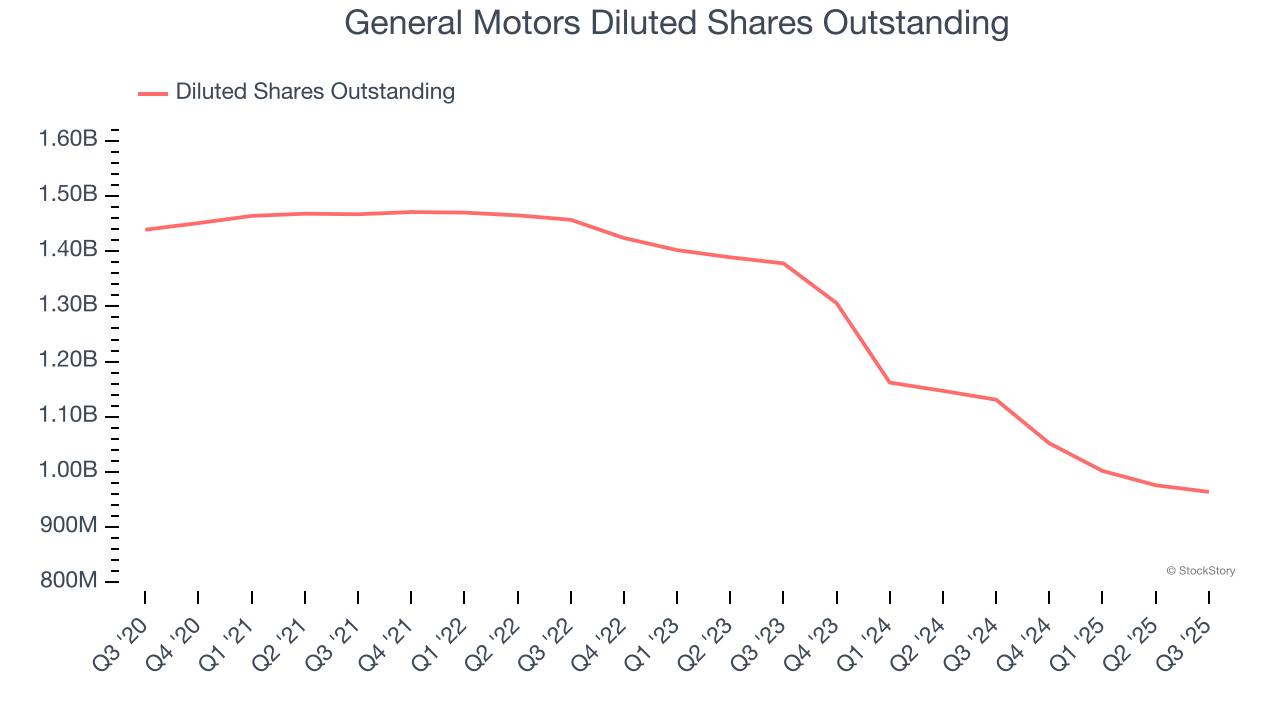
Like with revenue, we analyze EPS over a more recent period because it can provide insight into an emerging theme or development for the business.
For General Motors, its two-year annual EPS growth of 8.5% was lower than its five-year trend. We hope its growth can accelerate in the future.
In Q3, General Motors reported adjusted EPS of $2.80, down from $2.96 in the same quarter last year. Despite falling year on year, this print easily cleared analysts’ estimates. Over the next 12 months, Wall Street expects General Motors’s full-year EPS of $10.03 to shrink by 1.6%.
Key Takeaways from General Motors’s Q3 Results
We were impressed by how significantly General Motors blew past analysts’ revenue expectations this quarter. We were also glad its full-year EPS guidance trumped Wall Street’s estimates. Zooming out, we think this was a solid print. The stock traded up 8.1% to $62.74 immediately after reporting.
General Motors may have had a good quarter, but does that mean you should invest right now? The latest quarter does matter, but not nearly as much as longer-term fundamentals and valuation, when deciding if the stock is a buy. We cover that in our actionable full research report which you can read here, it’s free for active Edge members.