

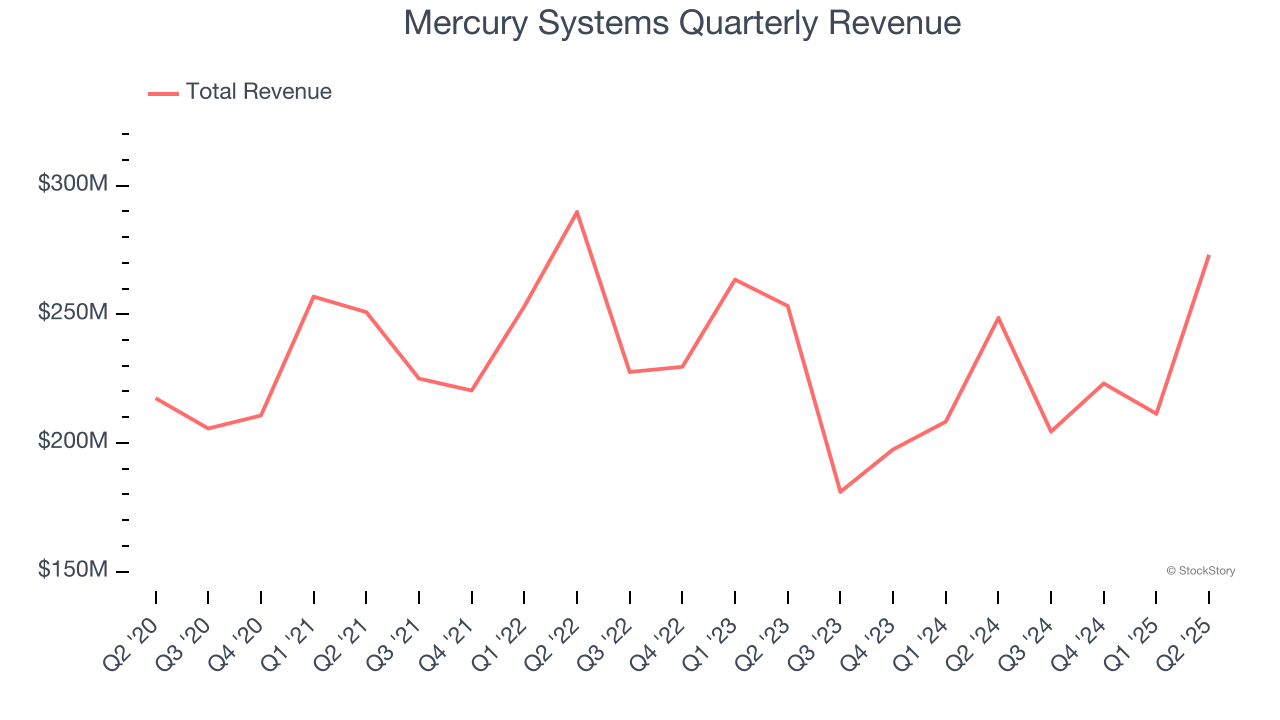
Aerospace and defense company Mercury Systems (NASDAQ:MRCY) reported revenue ahead of Wall Street’s expectations in Q2 CY2025, with sales up 9.9% year on year to $273.1 million. Its non-GAAP profit of $0.47 per share was significantly above analysts’ consensus estimates.
Is now the time to buy Mercury Systems? Find out by accessing our full research report, it’s free.
Mercury Systems (MRCY) Q2 CY2025 Highlights:
- Revenue: $273.1 million vs analyst estimates of $244.2 million (9.9% year-on-year growth, 11.9% beat)
- Adjusted EPS: $0.47 vs analyst estimates of $0.22 (significant beat)
- Adjusted EBITDA: $51.27 million vs analyst estimates of $34.54 million (18.8% margin, 48.4% beat)
- Operating Margin: 8.6%, up from -3.2% in the same quarter last year
- Free Cash Flow Margin: 12.4%, down from 24.7% in the same quarter last year
- Backlog: $1.4 billion at quarter end, up 5.3% year on year
- Market Capitalization: $3.16 billion
“We delivered very strong results in the fourth quarter that were once again in line with or ahead of our expectations, resulting in solid year-over-year growth in backlog, revenue, net income, adjusted EBITDA, and free cash flow for our full fiscal year 2025,” said Bill Ballhaus, Mercury’s Chairman and CEO.
Company Overview
Founded in 1981, Mercury Systems (NASDAQ:MRCY) specializes in providing processing subsystems and components for primarily defense applications.
Revenue Growth
Reviewing a company’s long-term sales performance reveals insights into its quality. Any business can experience short-term success, but top-performing ones enjoy sustained growth for years. Regrettably, Mercury Systems’s sales grew at a sluggish 2.7% compounded annual growth rate over the last five years. This was below our standards and is a rough starting point for our analysis.
We at StockStory place the most emphasis on long-term growth, but within industrials, a half-decade historical view may miss cycles, industry trends, or a company capitalizing on catalysts such as a new contract win or a successful product line. Mercury Systems’s performance shows it grew in the past but relinquished its gains over the last two years, as its revenue fell by 3.2% annually. 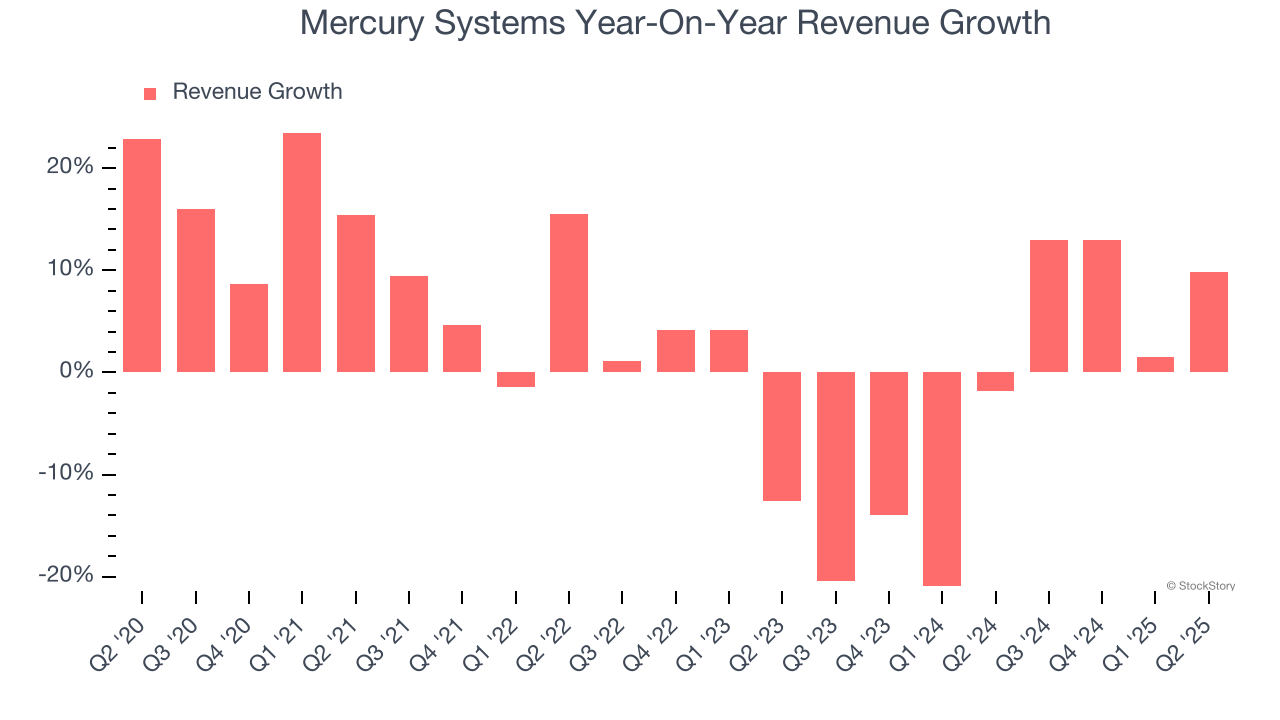
We can better understand the company’s revenue dynamics by analyzing its backlog, or the value of its outstanding orders that have not yet been executed or delivered. Mercury Systems’s backlog reached $1.4 billion in the latest quarter and averaged 5.3% year-on-year growth over the last two years. Because this number is better than its revenue growth, we can see the company accumulated more orders than it could fulfill and deferred revenue to the future. This could imply elevated demand for Mercury Systems’s products and services but raises concerns about capacity constraints. 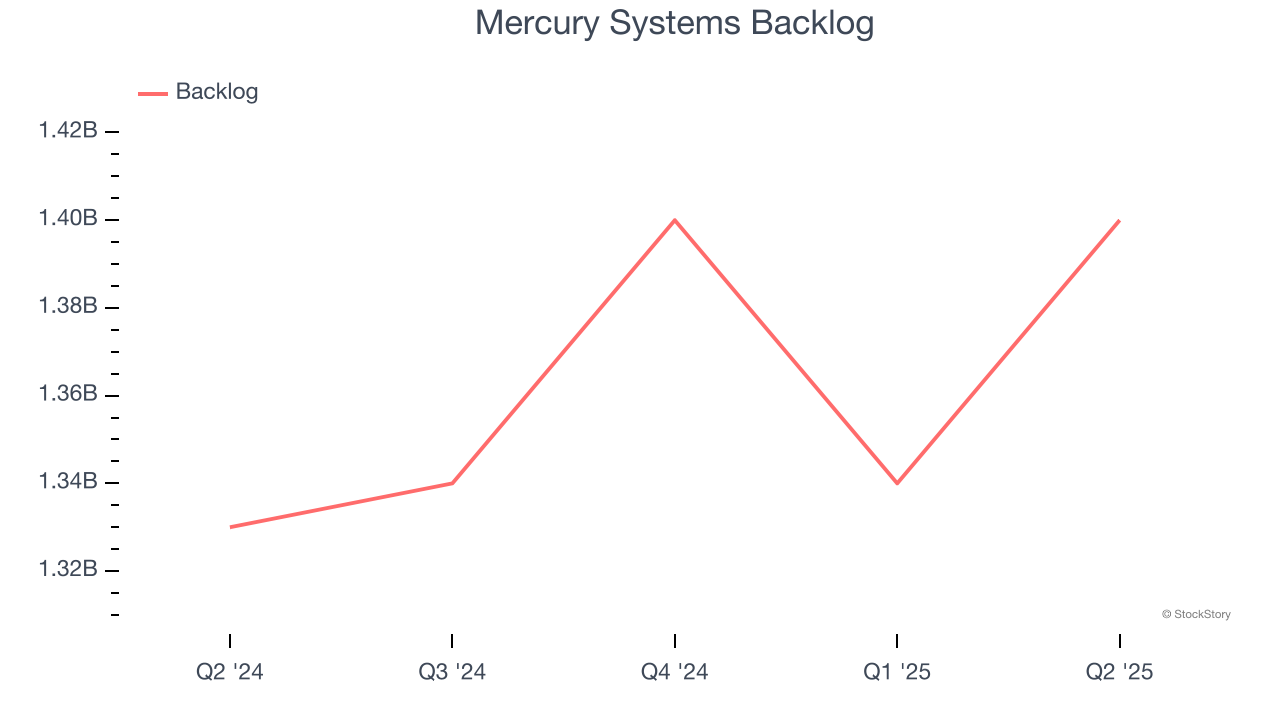
This quarter, Mercury Systems reported year-on-year revenue growth of 9.9%, and its $273.1 million of revenue exceeded Wall Street’s estimates by 11.9%.
Looking ahead, sell-side analysts expect revenue to grow 3.2% over the next 12 months. While this projection implies its newer products and services will catalyze better top-line performance, it is still below the sector average.
Unless you’ve been living under a rock, it should be obvious by now that generative AI is going to have a huge impact on how large corporations do business. While Nvidia and AMD are trading close to all-time highs, we prefer a lesser-known (but still profitable) stock benefiting from the rise of AI. Click here to access our free report one of our favorites growth stories.
Operating Margin
Operating margin is an important measure of profitability as it shows the portion of revenue left after accounting for all core expenses – everything from the cost of goods sold to advertising and wages. It’s also useful for comparing profitability across companies with different levels of debt and tax rates because it excludes interest and taxes.
Although Mercury Systems was profitable this quarter from an operational perspective, it’s generally struggled over a longer time period. Its expensive cost structure has contributed to an average operating margin of negative 1.7% over the last five years. Unprofitable industrials companies require extra attention because they could get caught swimming naked when the tide goes out. It’s hard to trust that the business can endure a full cycle.
Looking at the trend in its profitability, Mercury Systems’s operating margin decreased by 10.9 percentage points over the last five years. This raises questions about the company’s expense base because its revenue growth should have given it leverage on its fixed costs, resulting in better economies of scale and profitability. Mercury Systems’s performance was poor no matter how you look at it - it shows that costs were rising and it couldn’t pass them onto its customers.
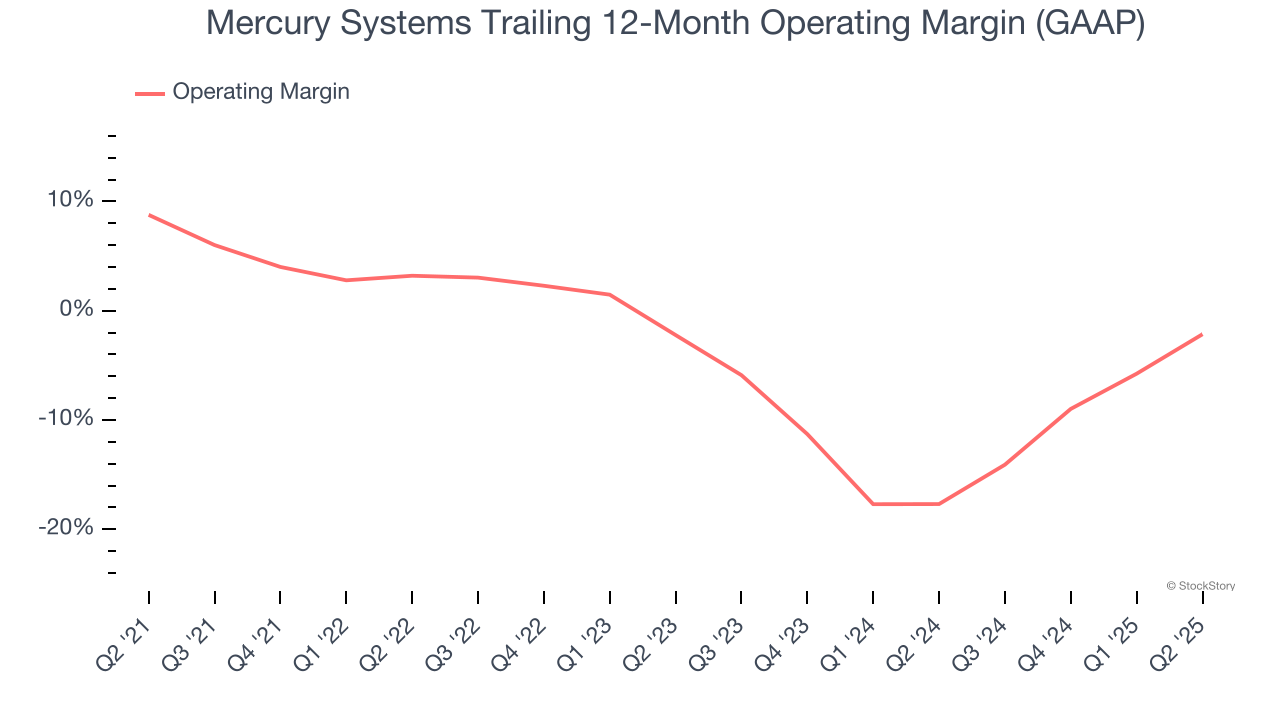
This quarter, Mercury Systems generated an operating margin profit margin of 8.6%, up 11.8 percentage points year on year. This increase was a welcome development and shows it was more efficient.
Earnings Per Share
We track the long-term change in earnings per share (EPS) for the same reason as long-term revenue growth. Compared to revenue, however, EPS highlights whether a company’s growth is profitable.
Sadly for Mercury Systems, its EPS declined by 22.5% annually over the last five years while its revenue grew by 2.7%. This tells us the company became less profitable on a per-share basis as it expanded.
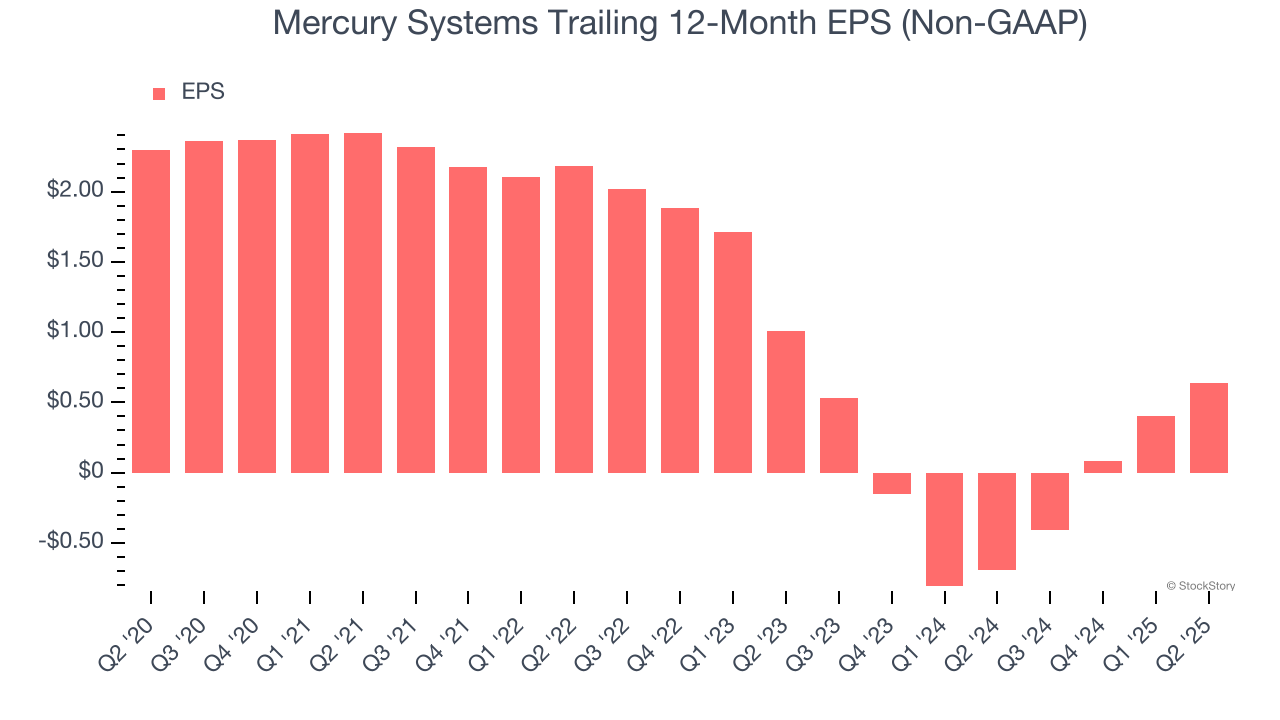
We can take a deeper look into Mercury Systems’s earnings to better understand the drivers of its performance. As we mentioned earlier, Mercury Systems’s operating margin expanded this quarter but declined by 10.9 percentage points over the last five years. Its share count also grew by 7.7%, meaning the company not only became less efficient with its operating expenses but also diluted its shareholders. 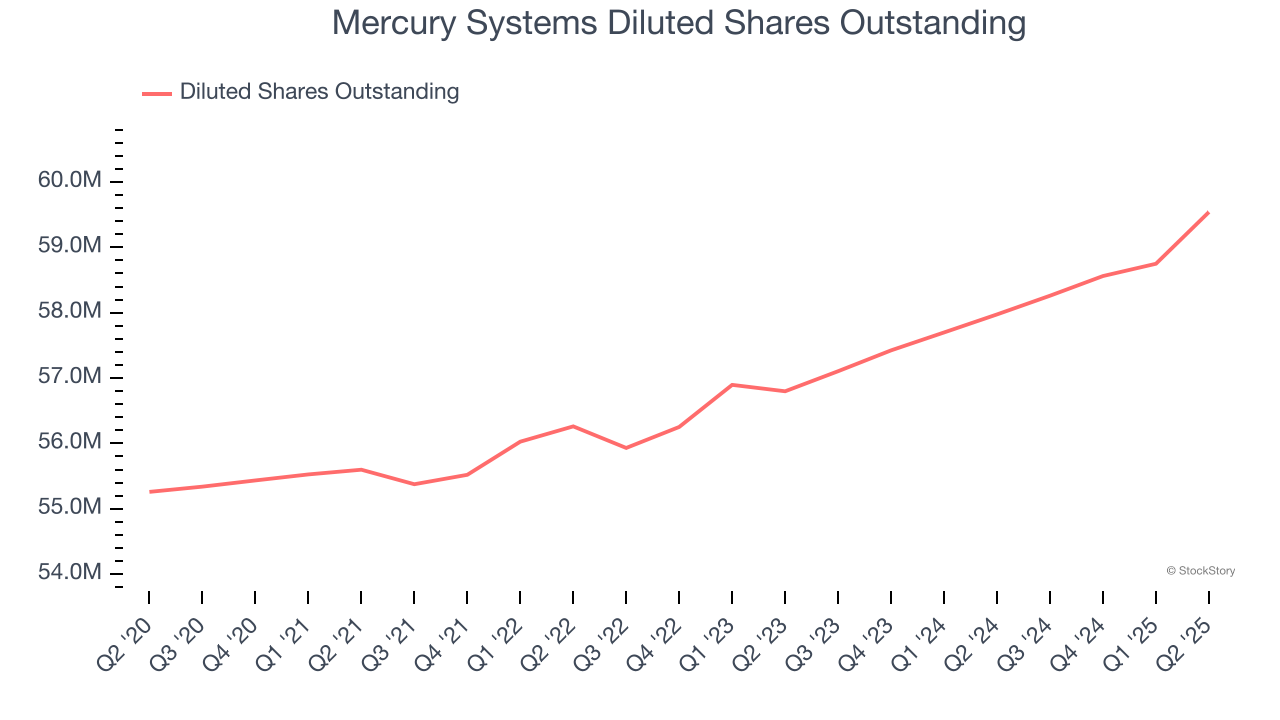
Like with revenue, we analyze EPS over a shorter period to see if we are missing a change in the business.
For Mercury Systems, its two-year annual EPS declines of 20.4% show it’s still underperforming. These results were bad no matter how you slice the data.
In Q2, Mercury Systems reported adjusted EPS at $0.47, up from $0.23 in the same quarter last year. This print easily cleared analysts’ estimates, and shareholders should be content with the results. Over the next 12 months, Wall Street expects Mercury Systems’s full-year EPS of $0.64 to grow 42.8%.
Key Takeaways from Mercury Systems’s Q2 Results
We were impressed by how significantly Mercury Systems blew past analysts’ EPS expectations this quarter. We were also excited its EBITDA outperformed Wall Street’s estimates by a wide margin. Zooming out, we think this was a solid print. The stock traded up 2.2% to $54.89 immediately after reporting.
Mercury Systems had an encouraging quarter, but one earnings result doesn’t necessarily make the stock a buy. Let’s see if this is a good investment. The latest quarter does matter, but not nearly as much as longer-term fundamentals and valuation, when deciding if the stock is a buy. We cover that in our actionable full research report which you can read here, it’s free.